The number I actually care about with a PV system isn't how much the panels produced. It's how much of it I kept. The inverter's cloud portal shows me a self-consumption percentage and an autarky percentage on a nice dashboard, and for a long time I treated those two figures as the scoreboard for the whole house. The problem: they live in someone else's cloud, I can't chart their history the way I want, and I can't alert on them. So I rebuilt them in Home Assistant. The catch I didn't expect is that Home Assistant doesn't hand you any of these numbers either.
This is Part 02 of the series. Part 01 covered getting Home Assistant running via Docker and pulling the inverter in over Modbus. Now that the raw counters are flowing, this post is about turning them into the four metrics I wanted: self-consumption, autarky, battery round-trip efficiency, and a string-imbalance watchdog.
Home Assistant gives you counters, not KPIs
Here's the honest part. Home Assistant has an Energy Dashboard, and it's genuinely good at showing you a picture: production, grid import, grid export, battery flow. What it does not expose are the derived percentages. There is no sensor.self_consumption entity. There is no sensor.autarky entity. The Energy Dashboard computes that picture internally and draws it, but it never hands you the numbers back as entities you can chart over a year or trip an automation on.
My inverter is a Huawei SUN2000, and even its own integration only surfaces the raw lifetime and daily counters — total yield, grid feed-in, grid import, battery charge, battery discharge. Everything else I want is arithmetic on top of those. So I built the metrics myself as Home Assistant template sensors, defined in a templates.yaml file. That distinction matters to me: these aren't values the integration gave me, they're values I derived, which means I get to decide exactly how they're calculated.
Self-consumption and the reconstruction problem
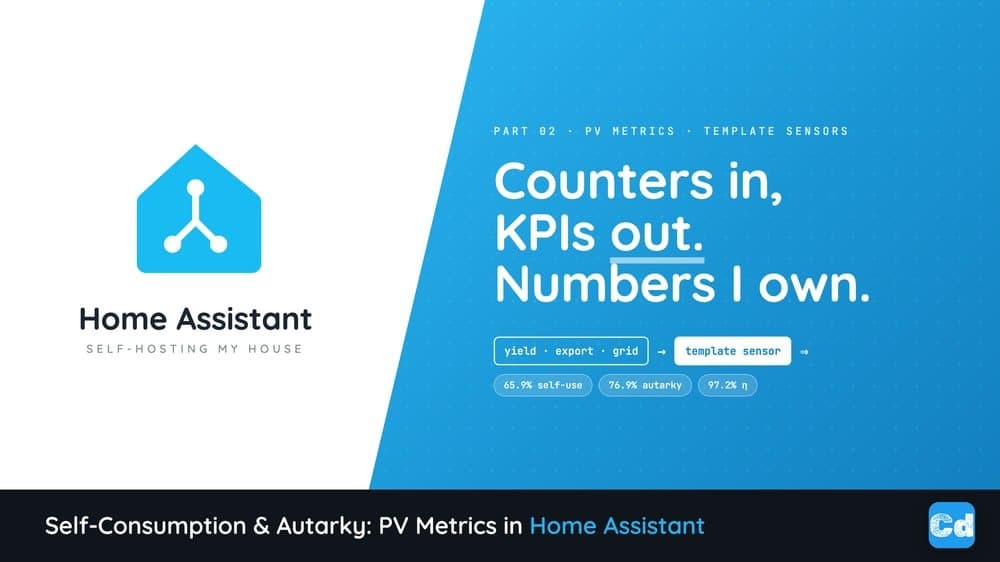
Self-consumption is the easy one. It's the share of what you produced that you actually used yourself instead of exporting: total yield minus grid export, over total yield. My Eigenverbrauchsquote sensor does exactly that and lands around 65.9% — and it matches the number the cloud portal shows, which was a satisfying moment, because it meant I'd correctly reverse-engineered what the cloud was doing. Same logic, just running locally instead of in someone's data centre.
Autarky is where it gets interesting, and where the honest engineering beat lives. Autarky is the share of your consumption covered by your own production — one minus (grid import over consumption). But Home Assistant never measures household consumption directly. Nobody does, unless you've wired a meter on the main feed. So you reconstruct it from three counters: consumption equals yield, minus what you exported, plus what you pulled from the grid. That reconstructed consumption is what goes in the denominator. My Autarkiegrad sensor sits around 76.9%.
I want to be clear that this is a reconstruction, not a reading. If your counters drift, your autarky drifts with them. But for a household figure, three counters and a bit of algebra get you a number that's plenty accurate to act on — and it's a number that's now mine, living in my own history, not the inverter vendor's.
# Autarky as a Home Assistant template sensor
- name: "Autarkiegrad"
  unit_of_measurement: "%"
  icon: "mdi:leaf"
  state: >
    {% set ertrag = states('sensor.pv_gesamt_ertrag') | float(0) %}
    {% set einspeisung = states('sensor.netzeinspeisung_gesamt') | float(0) %}
    {% set netzbezug = states('sensor.netzbezug_gesamt') | float(0) %}
    {% set verbrauch = ertrag - einspeisung + netzbezug %}
    {% if verbrauch > 0 %}
      {{ ((1 - netzbezug / verbrauch) * 100) | round(1) }}
    {% else %}
      0
    {% endif %}
The entity names are German because they're mine — Autarkiegrad, Eigenverbrauchsquote — and I gave each a fitting icon, mdi:leaf for autarky and mdi:home-lightning-bolt for self-consumption. Small thing, but a leaf next to your autarky number in the dashboard is quietly motivating.
Battery health, in two cheap sensors
The battery deserves its own KPIs, and the nice thing is they fall out of counters you already have. Round-trip efficiency is just energy out over energy in: discharge over charge. My Batterie Effizienz sensor reports 97.2%, which is genuinely healthy for a home battery, and because it's a sensor with history I can watch that number slowly degrade over the years instead of finding out the hard way.
The second one is a full-cycle estimate. I don't have a true cycle counter, so I approximate: total charged kWh divided by 10, on the assumption of roughly 10 kWh usable capacity. It's a proxy, not a precise odometer, but as an equivalent-full-cycles figure it's a perfectly reasonable way to track wear. Cheap to compute, useful to chart.
There's also a tiny detail I enjoy. My boiler temperature comes off a Modbus register that reports tenths of a degree as a raw integer, so a Temperatur Boiler Präzise sensor just divides the raw value by 10. Nothing clever, but it's the kind of thing you only learn by reading the register table — the hardware speaks in tenths, and you have to scale it back yourself.
The watchdog: catching a sick string before the cloud would
My favourite sensor in the whole file is the string-imbalance detector. A PV array usually has two strings, and in healthy conditions their currents track each other closely. When one drifts well below the other, something is wrong — shading, a dead module, or a loose connector. The cloud portal hides this kind of diagnosis behind its own logic; I wanted it local and visible.
The sensor, PV String Differenz, computes the percentage difference between the two string currents. The gotcha — and this is the part worth showing — is night-time. At night both string currents fall to near zero, and a naive difference divided by a near-zero max blows up into meaningless noise. So the template only computes when the larger current is above 0.5 A; below that it just reports 0.
# String-imbalance detector — note the >0.5 A guard so it isn't noise at night
- name: "PV String Differenz"
  unit_of_measurement: "%"
  state: >
    {% set s1 = states('sensor.pv_string_1_strom') | float(0) %}
    {% set s2 = states('sensor.pv_string_2_strom') | float(0) %}
    {% set max_val = [s1, s2] | max %}
    {% if max_val > 0.5 %}
      {{ ((s1 - s2) | abs / max_val * 100) | round(1) }}
    {% else %}
      0
    {% endif %}
On its own that's just a number. The payoff is the automation behind it. PV String Anomalie Warnung fires when the difference stays above 30% for a sustained 30 minutes — the debounce matters, because a passing cloud will briefly imbalance the strings and you don't want a false alarm every time. It's also guarded to only fire in daylight, when string 1 is actually carrying current above 1 A. And the message it sends me literally spells out the likely causes: shading, a defective module, or a loose connector. That's the same diagnostic the inverter cloud keeps to itself, except now it's a push to my phone and I own the logic.
One line a day, and why it's worth it
The other automation is less dramatic but I read it every single evening. PV Tagesbericht fires once a day at 20:00 and crams the whole scoreboard into one push: the day's yield, battery charge and discharge, self-consumption percentage, autarky percentage, and lifetime yield in MWh. The lifetime figure comes off the raw watt-hour counter divided by 1000 and rounded to two decimals — another small scaling detail, like the boiler.
I also keep daily mirrors — Eigenverbrauch Heute and Verbrauch Heute — that recompute today's self-consumption and consumption from the daily yield, daily feed-in, and daily grid-import counters, so the daily figures use the same arithmetic as the lifetime ones. Percentages round to one decimal, daily kWh to two, cycles to zero. Tidy enough that the evening push reads like a clean report rather than a dump of floats.
That's the whole thread of this series, really: own your data, self-host the dashboard. The inverter cloud can show me a self-consumption gauge, but it can't let me alert on a sick string, chart my battery's efficiency over five years, or hand me a single evening line with everything in it. Home Assistant doesn't give you those metrics for free — but once you've reconstructed them from the raw counters, they're sensors like any other: chartable, alertable, and yours. Next in the series, I'll wire these numbers into actually doing something with the surplus.
Two more pieces from the same PV setup, if you're building this out: catching a failing PV string before the autarky number quietly drops, and the Shelly Plus 1PM/2PM relays I use for the switchable loads.